Over the years, I’ve discovered a collection of free Windows tools that help me diagnose what’s dragging my system down. These tools have saved me countless hours and helped me avoid expensive computer repairs from certified technicians.
6
Windows Device Performance and Health
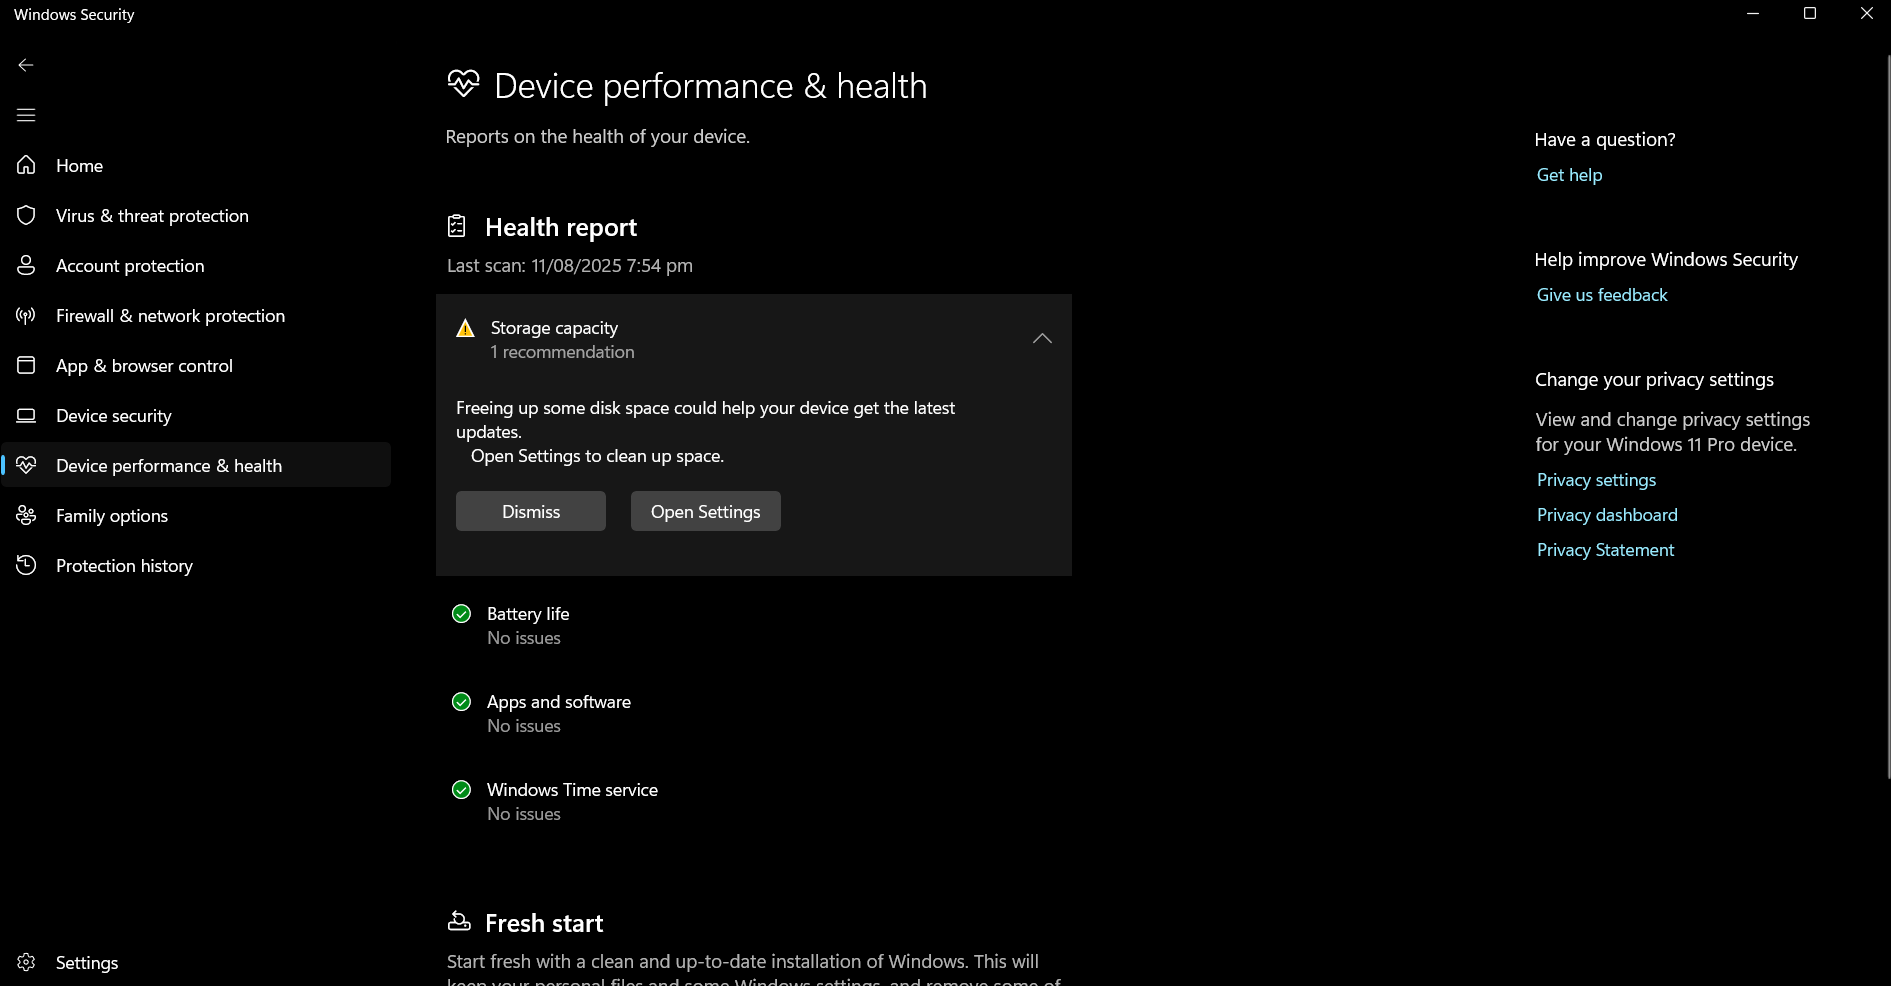
Let’s start with the simplest way to check your computer’s overall condition. The Windows Device Performance & Health feature is my go‑to tool for an initial check. Whenever I feel something isn’t performing well, I open this tool and quickly look for yellow warning icons. It lets me review storage capacity, battery health, potential app issues, and whether my system time is properly synced.
To visit it, press the Windows key, type “Windows Security”, and hit Enter. When Windows Security opens, click Device performance & health. The interface shows a simple dashboard with green checkmarks when everything is working properly, or yellow warning icons when something needs attention.
In this example, the Storage capacity section warns me that I’m running low on disk space. I’ve learned that Windows needs at least 20 percent of my storage drive space free to run efficiently. So after seeing the warning here, I clicked See more info and accessed Windows’ storage settings, where I could easily clean up files.
I also find the Battery life section incredibly useful on my laptop. It shows which apps are draining the battery more than they should and suggests ways to extend battery life. Though it’s not as powerful as some of the best tools for analyzing laptop battery, it’s still my favorite because it’s simple to use and is already baked into Windows. These types of tools are especially helpful when I forget my charger while I’m out writing for the day.
5
Windows Resource Monitor
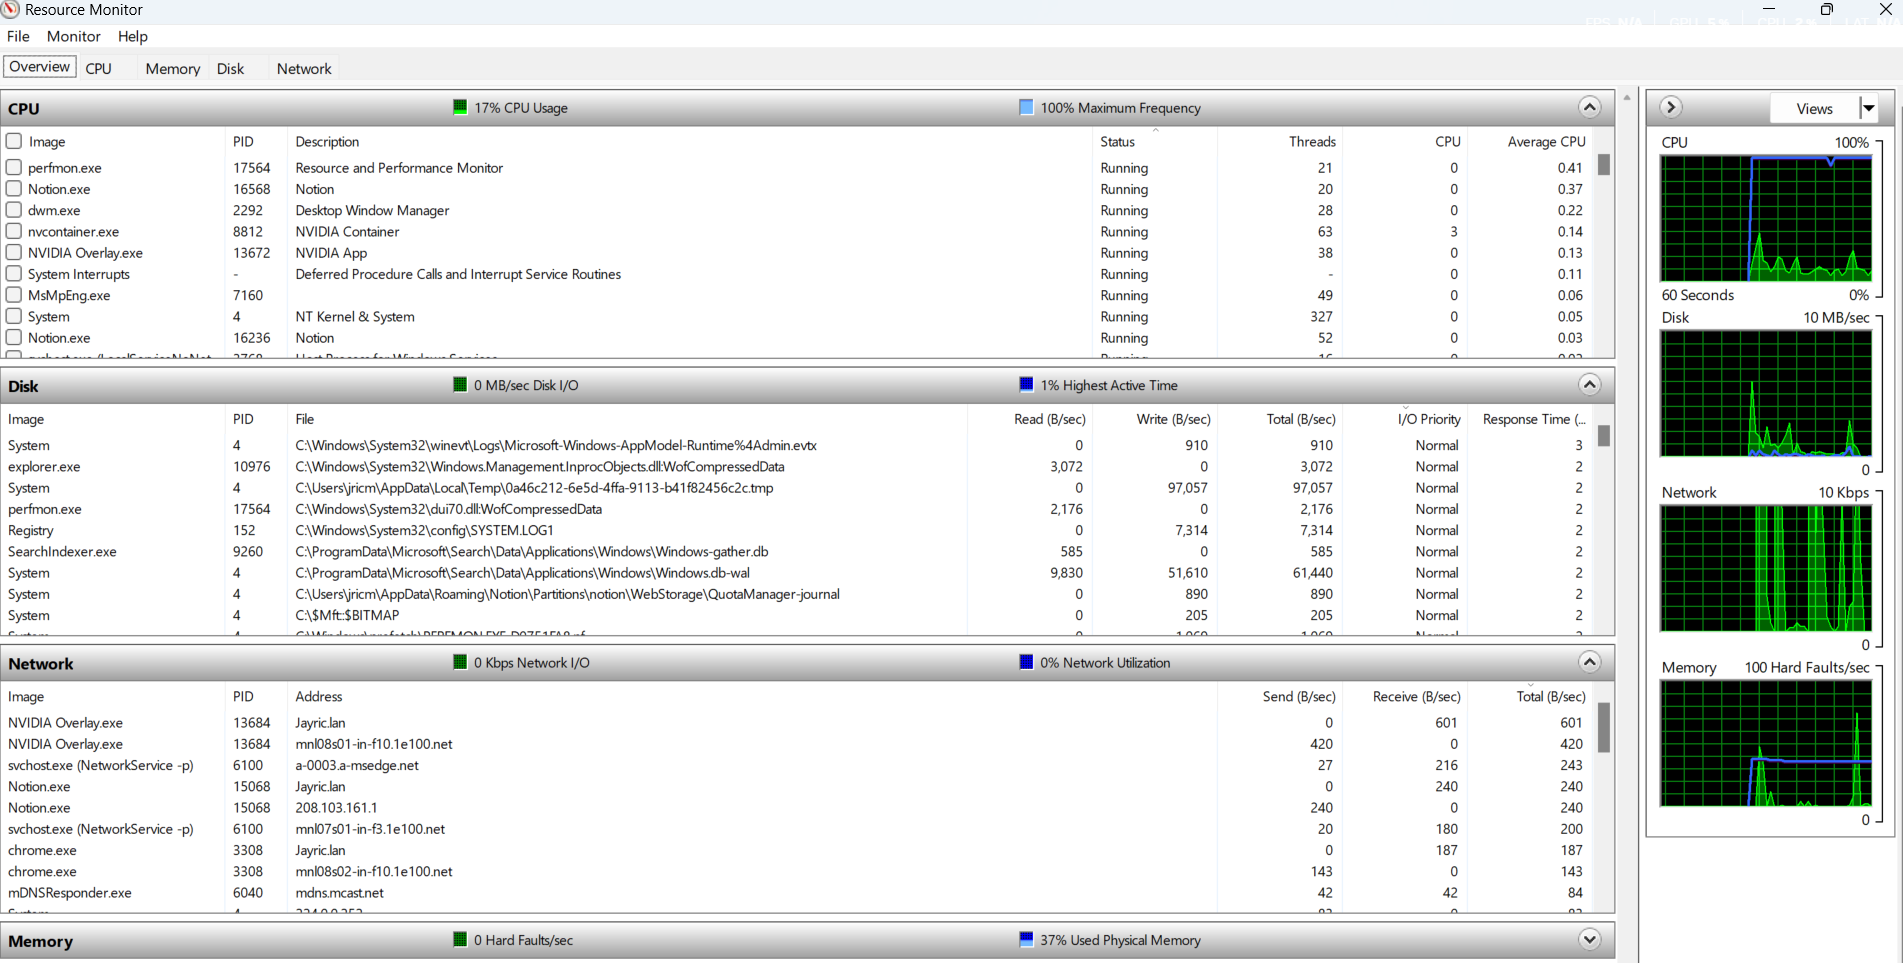
Windows Resource Monitor is my go-to tool whenever I have to diagnose a family member’s sluggish computer. It’s free and comes installed as part of the OS, making it convenient to use. This feature allows me to get real-time data about everything that consumes system resources.
To access Resource Monitor, press the Windows key, type “resmon”, and hit Enter. You can also access it through Task Manager (Ctrl + Shift + Esc) by clicking the Performance tab and then Open Resource Monitor at the bottom.
The Overview tab shows you a complete picture of the system’s health. With this tool, I can see which processes are eating up a system’s CPU, memory, disk, and network resources in one place. This allows me to quickly tell what’s causing the problem.
Just a few days ago, I discovered that Adobe Lightroom was constantly writing to my desktop PC’s storage disk even when I wasn’t using it. On the Disk tab, I saw it under Processes with Disk Activity with massive write operations. It turns out Lightroom Classic was hammering the disk because it was rebuilding previews and updating catalogs in the background. I easily fixed the problem by moving the entire catalog and preview files to a secondary drive and updating Lightroom’s default location for these files.
If I had used only Task Manager’s Performance tab, I would have seen a quick overview of system usage. With Resource Monitor, I identified the exact app and processes causing the slowdown and the files they were hitting.
4
Windows Memory Diagnostic
RAM problems can make your computer behave in weird ways. I’ve seen systems that randomly freeze, crash with blue screens, or run incredibly slowly because of faulty memory. Windows Memory Diagnostic helps me test RAM without needing any third-party software.
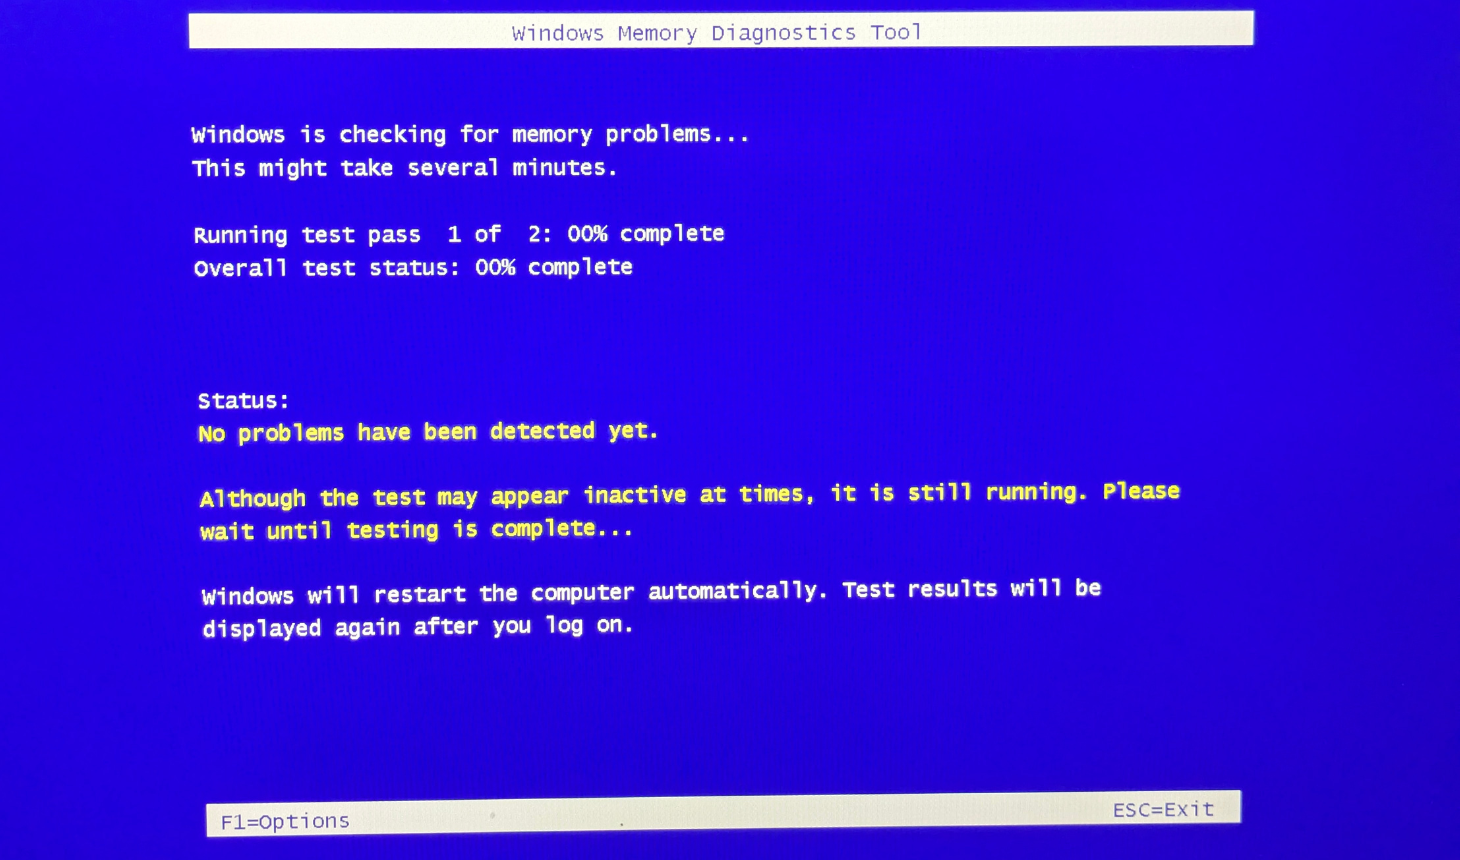
Open this tool by pressing Win + R, then typing “mdsched.exe” and pressing Enter. The Windows Memory Diagnostic window pops up with two options; I usually choose Restart now and check for problems because I want immediate results.
The computer will reboot and show a blue screen with a progress bar. If I want to be thorough, I press F1 during the test to access advanced options. Here, I can choose Extended testing and increase the number of passes.
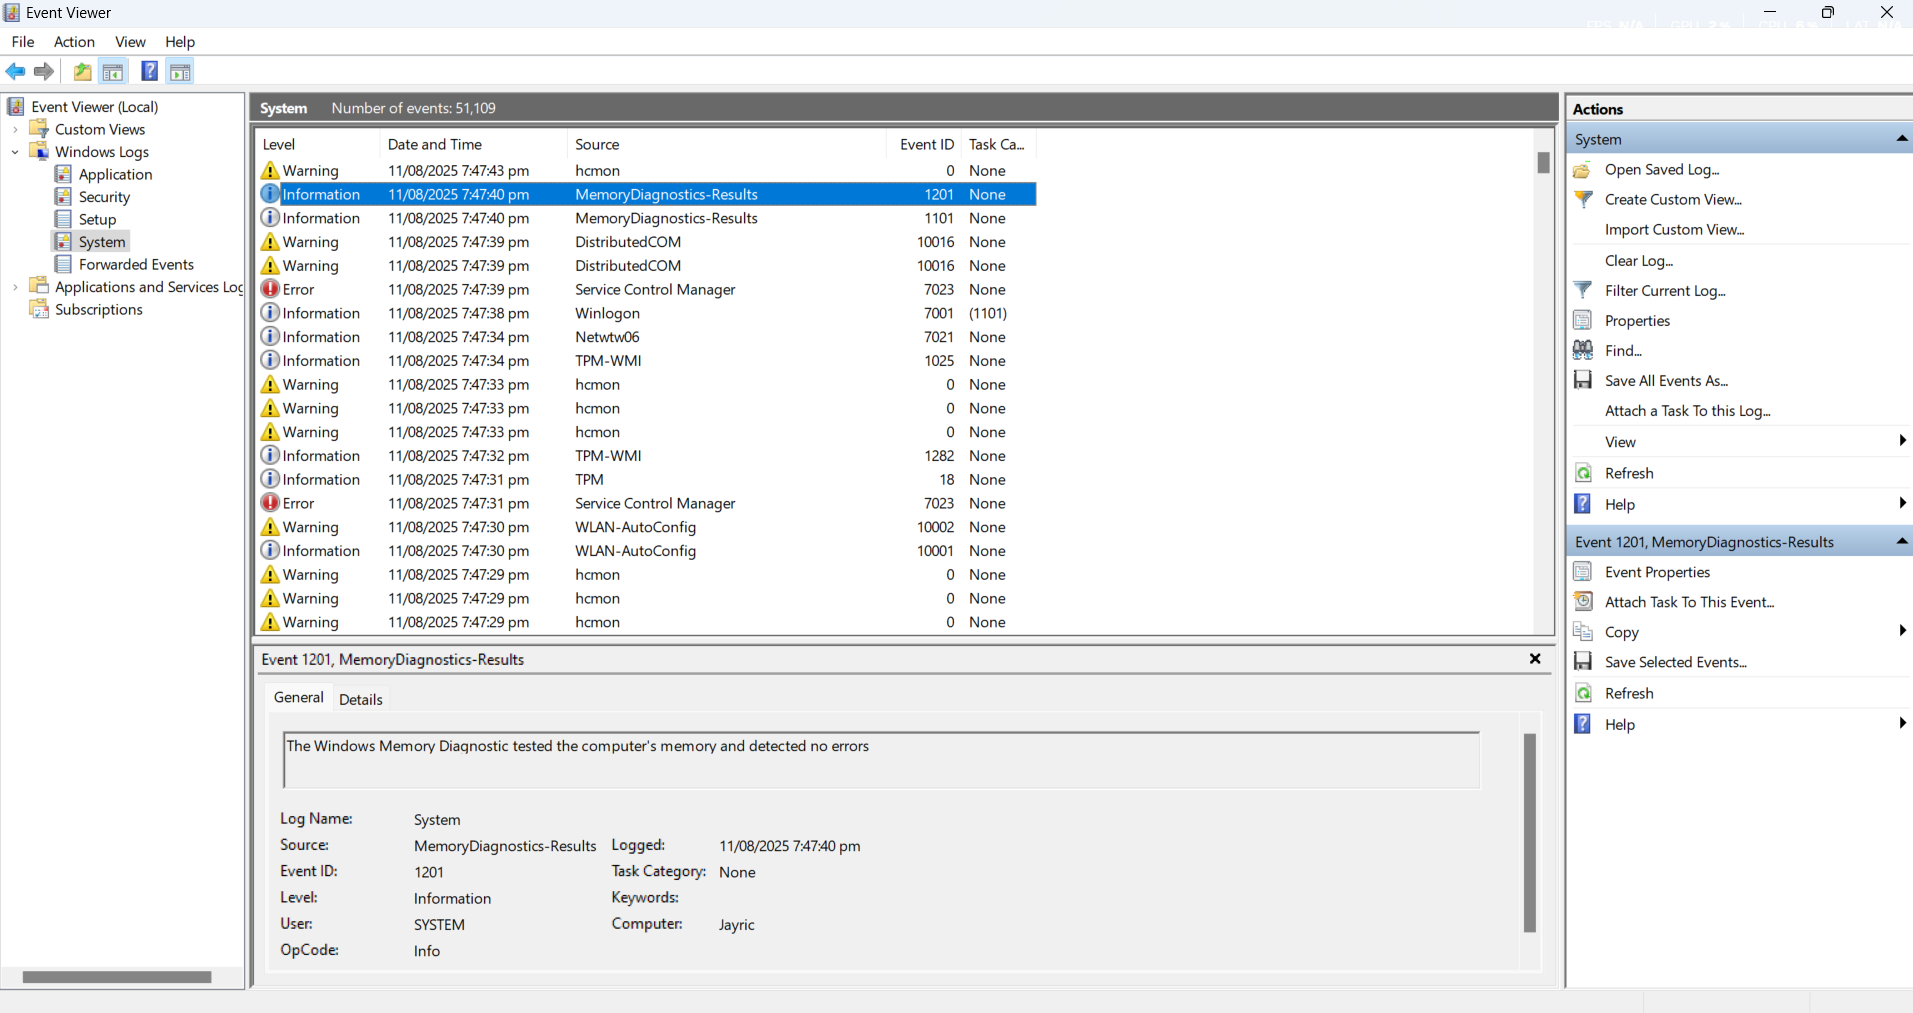
After the test completes and Windows boots up, I check the results in Event Viewer. I press Win + X, select Event Viewer, expand Windows Logs, click System, then use Ctrl + F to search for “MemoryDiagnostics-Results”.
3
HWiNFO
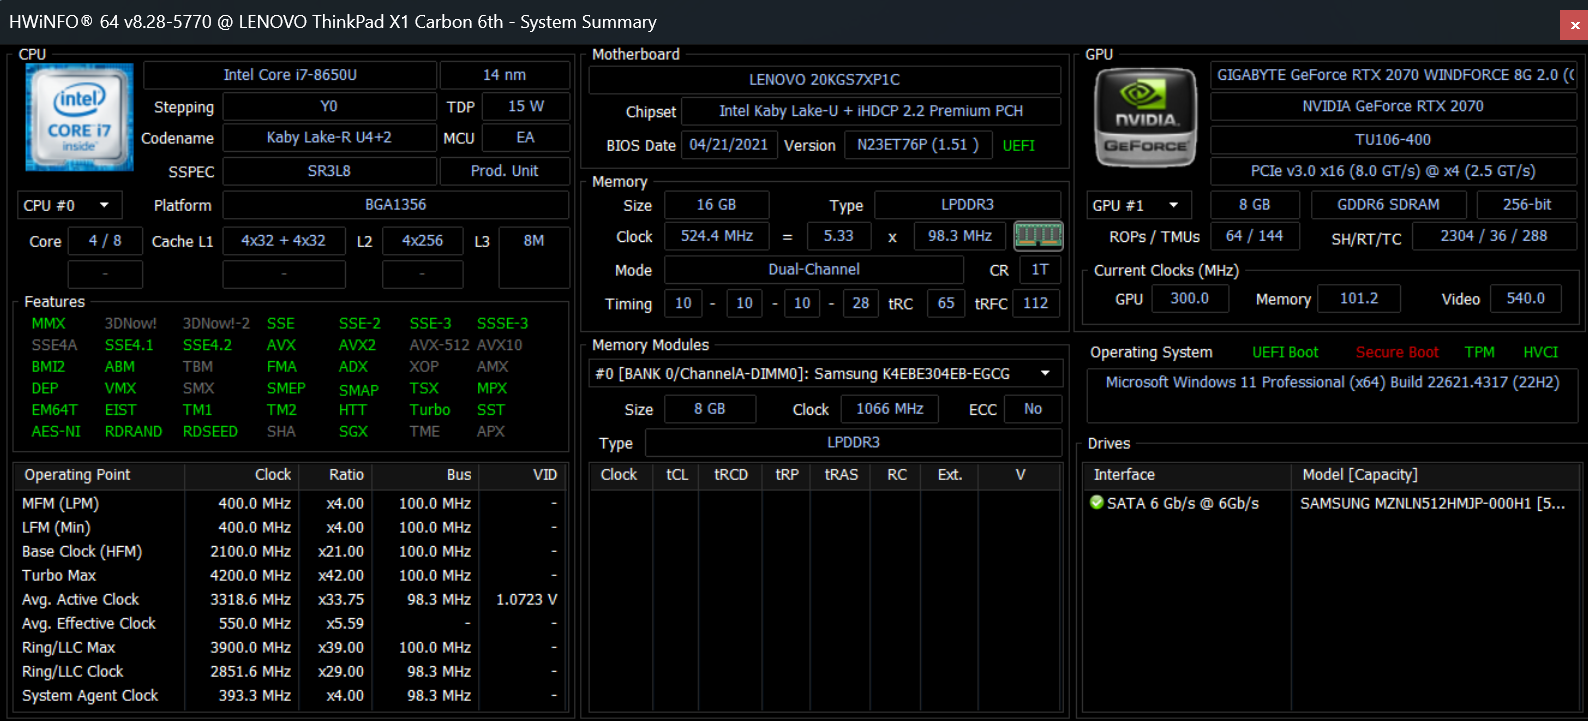
While Windows has great built-in tools, sometimes I need more detailed hardware information. HWiNFO gives me incredibly detailed information about every component on my computer, plus real-time monitoring of temperatures, voltages, and fan speeds.
First, download HWiNFO using the Installer option. Extract the contents of the file and run the standard 64-bit installation. You can then launch HWiNFO by searching for it like any other app; click Run to get both the Summary and Sensors windows.
The Summary window shows detailed information about every component on my computer. The Sensors window is where I spend most of my time because it shows real-time monitoring data that updates every few seconds. Green values are normal, yellow indicates caution, and red means immediate attention is needed.
I keep this open when I’m gaming or running intensive programs to make sure nothing is overheating. I’ve caught overheating problems early several times using this tool. Last summer, my CPU temperatures started hitting 90°C while gaming. HWiNFO clearly showed me this info, and I was able to replace my computer’s fans before any damage occurred.
The program also tracks long-term statistics and can log data to files, which has helped me identify patterns and diagnose intermittent problems. I can customize which sensors are displayed and hide the ones I don’t need.
2
Wintoys
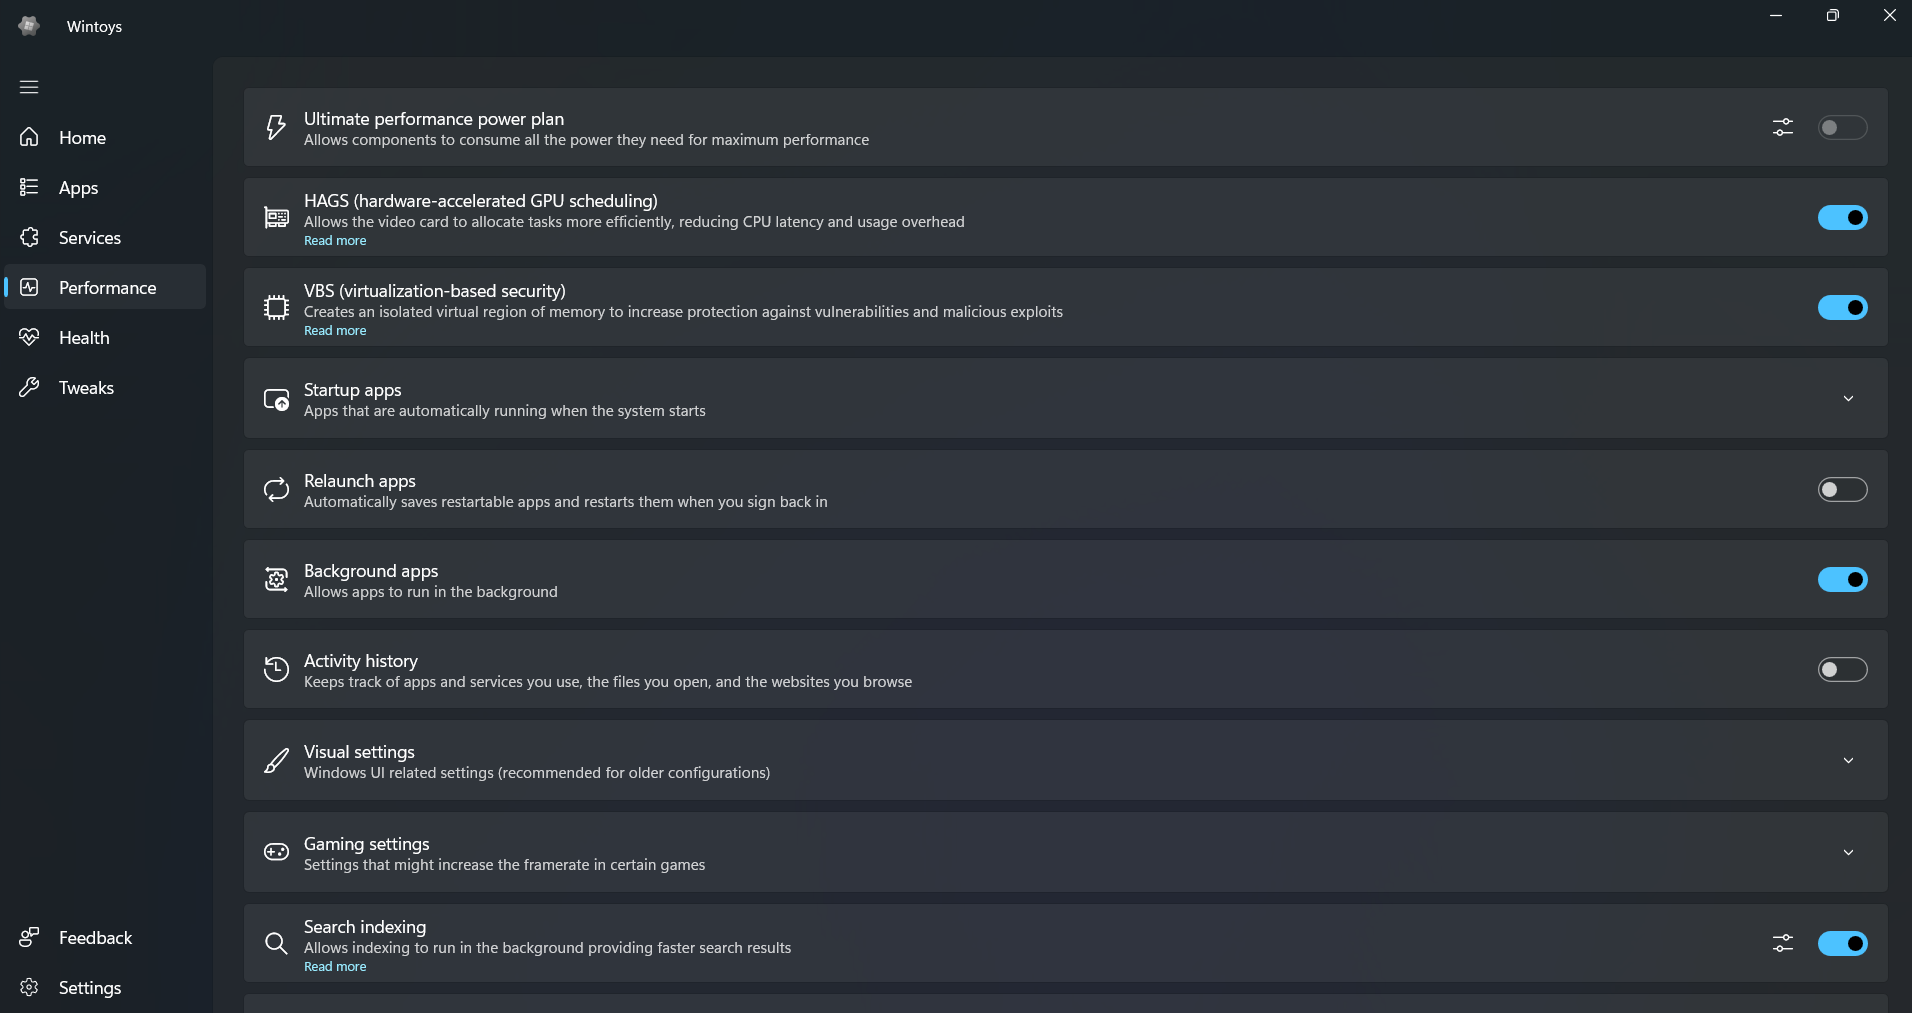
For everyday system diagnostics without the technical complexity, Wintoys brings together many of Windows’ scattered settings and tools into one clean interface. It’s so well-made that it’s one of those apps that should be preinstalled on all Windows computers. After downloading Wintoys from the Microsoft Store, it’s become my go-to when I need quick system checks rather than deep hardware monitoring.
There are many ways you can use Wintoys to optimize your computer’s performance; for diagnostics, the main dashboard shows live CPU, GPU, and memory usage graphs. This means I can immediately spot if something is consuming too many resources. I then go to the Health section located in the sidebar, followed by Repair.
Here I can run powerful diagnostic utilities like DISM (which repairs the core Windows system image), SFC (which scans and fixes individual system files), and CHKDSK (which checks hard drives for errors and bad sectors) with simple one-click buttons. When I suspect file corruption or system errors, I can run these repair tools all from a clean interface.
After doing checks and repairs, I go to the main dashboard to see if there are any changes in my PC’s performance. I also use the flame icon on the dashboard to run a quick system benchmark, which helps me confirm how much faster the system feels after the adjustments I made in and outside Wintoys.
1
CrystalDiskInfo
Storage drive health deserves special attention, which is where CrystalDiskInfo comes in. While both HWiNFO and Wintoys can show basic drive information, neither focuses specifically on predicting drive failures like CrystalDiskInfo does.
You can download CystalDiskInfo on SourceForge; the CystalDiskInfo site has anime-themed versions you might not want. After downloading, unzip the file and open DiskInfo64.exe to open the 64-bit version of the app. Once opened, CrystalDiskInfo immediately scans all storage devices and displays their health status.
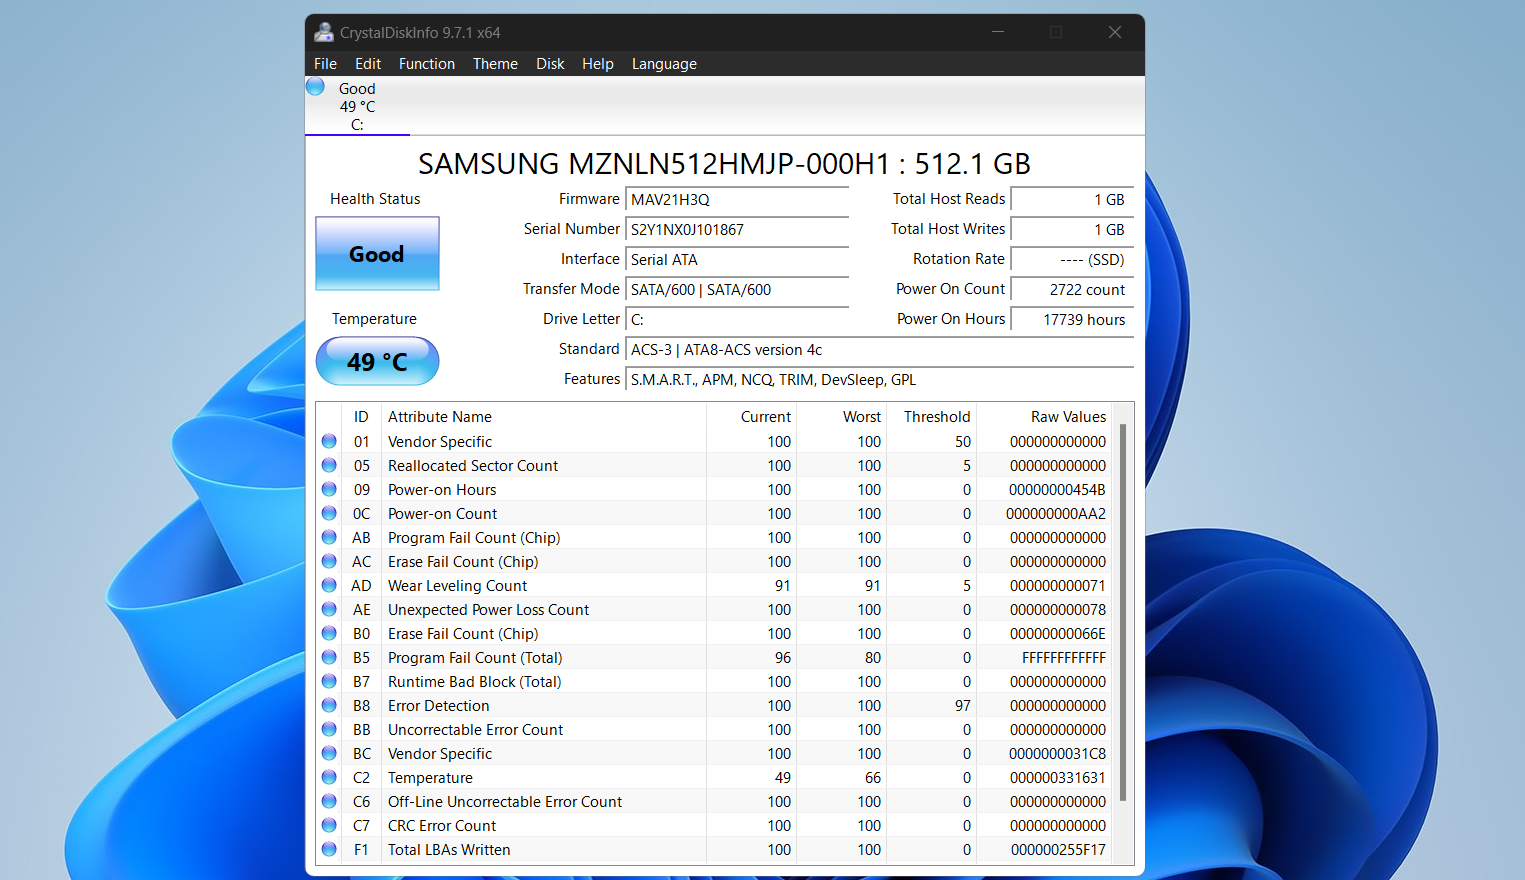
The main window shows me the overall health status of each drive using simple terms like Good, Caution, or Bad with color-coding. Green means good, yellow means caution, and red means problems detected. I can see the current temperature, total power-on hours, and power cycle count for each drive.
I pay special attention to the Reallocated Sectors Count in the detailed SMART data. When a hard drive starts developing bad sectors, it moves data to spare areas. A few reallocated sectors are normal over time, but rapidly increasing numbers indicate a drive that’s starting to fail.
I replaced two hard drives after CrystalDiskInfo warned me about high reallocated sector counts, and both times I was able to move my data before the drives completely failed. The program can also monitor drive temperatures and send email alerts if they get too hot.
For SSDs, CrystalDiskInfo shows me the remaining lifespan based on how much data has been written. I look for the Total Host Writes value to see how much data I’ve written to the drive over its lifetime.
These tools have become essential parts of my computer maintenance routine. They’ve helped me solve countless performance problems, prevent hardware failures, and keep my systems running smoothly. Best of all, they’re completely free and don’t require any technical expertise to use them effectively.
When your computer starts acting up, try these tools before calling for expensive repairs or buying a new machine.
